Coins flying with text saying Top money transfer remittance statistics

Top UK money transfer and remittance statistics for 2025

Global money transfers play a vital role in the world economy, and international remittances make up a significant proportion of all money sent, reaching £9.3 billion in 2023, according to The Migration Observatory. Many in the UK spend, save, and grow their money abroad.¹
 
In 2024 alone, UK remittance flows rose by 6.06% showing just how crucial these payments are and demonstrating the reliance of many people on digital financial systems.² In return, migrants and UK-born remitters earn their money in the UK, meaning they contribute to the economy through income tax, National Insurance, and VAT before sending money abroad.
 
Remitly breaks down the most crucial money transfer statistics to provide a complete picture of how UK senders compare to the rest of the world, and how remittances are changing year-on-year.

Top 10 statistics about money transfers in the UK

  1. £9.08 billion was sent abroad from the UK in 2024
  2. India is the top recipient of UK remittances, receiving £3.30 billion between 2020 and 2024
  3. Over 52% of remittances from the UK are completed in under an hour across over 80 remittance providers
  4. Average remittance fees have dropped globally across many remittance providers from 7.16% to 5.89% since 2019
  5. Cash is the most expensive way to send money, with, on average, 9.04% fees globally across various remittance providers
  6. 27% of UK residents born abroad sent remittances in 2021/22
  7. 85% of remittances from the UK arrive the same or the next day across many remittance providers
  8. Remittances from the UK have grown in send amount by 30.79% since 2020
  9. Nine in 10 UK-based remitters send money to support family and friends
  10. Bank transfers are the cheapest method, averaging 4.61% fees for a £148 send across various remittance providers and corridors, according to The World Bank
Stopwatch icon and stats showing 52% of remittances completed in under an hour

Statistics on money transfer averages

1. Over 52% of remittances across UK providers are completed in under an hour³

Thanks to increasingly integrated payment networks, more than one in two UK transfers across all measured remittance providers are completed within 60 minutes. The shift is driven by digital-to-digital payments that bypass slower legacy banking systems.
 
This speed is a key differentiator in a sector where rapid delivery can directly influence provider choice and encourage customers to reuse their services.

2. The average completion time for remittances is just under 16 hours³

According to the World Bank, across over 80 remittance providers to receiving countries, remittances are sent in just under 16 hours on average. This includes sending to countries like Bangladesh, China, and Pakistan.

3. 85% of transfers from the UK (across over 80 providers) arrive on the same day or the next day³

This high speed is a key driver of repeat use, especially for migrant workers supporting households that rely on frequent, small transfers for everyday expenses. Fast turnaround also helps build trust between senders and recipients, reinforcing loyalty to specific transfer providers.

4. Average remittance fees are dropping year-over-year³

Between 2019 and 2024, the World Bank found that the average fee for a £148 transfer fell from 7.16% to 5.89% when looking at over 80 remittance providers. This trend supports global goals to reduce remittance costs below 3%, a UN goal.⁴ Using a money transfer app often leads to lower fees, as they can avoid physical infrastructure costs and can offer better exchange rates.

5. Cash is the most expensive remittance sending method³

Cash-based send methods, such as depositing physical money in shops instead of bank transfers, can come with a steep price tag. The data shows this discrepancy here:
 
  • £148 transfer: 9.04% fees across over 80 providers*
  • £370 transfer: 6.54% fees across over 80 providers*
These extra charges can significantly reduce the value received for senders already working with tight budgets.

6. On average, bank transfers are the most cost-efficient option³

While this differs per corridor, data from The Migration Observatory, highlights how bank transfers are often the most cost-effective option, with average fees detailed below.
 
  • £148 transfer: 4.61% fees across over 80 providers*
  • £370 transfer: 5.51% fees across over 80 providers*
Bank transfers often offer people peace of mind when sending money abroad because the money sent is already in their accounts.
*Migration Observatory data reflects Q1 2019 to Q3 2024, the latest available as of August 2025.
World map showing international remittance flows and statistics

International remittance flows by country & region

The UK’s money transfer flows span developing and developed economies, with some corridors standing out due to the size of the diaspora, historical ties, and transaction costs. According to the latest data from the Migration Observatory, these are the largest recipients of UK remittances by value.

Parts of Europe (including France, Germany, and Poland): £7.05 billion¹

Despite a focus on remittances to developing countries, intra-European money transfers are among the largest in volume, particularly between the UK and countries like France, Germany, and Poland. These transfers are often a result of labour migration, temporary employment, and dual-residency arrangements.

India: £3.30 billion received from the UK¹

In 2024, £3.30 billion flowed from the UK to India, accounting for more than a third of all UK remittances. The UK’s sizable Indian diaspora and competitive transfer fees (3.23% for £148, 1.75% for £370 across various providers) make this corridor both high-volume and low-cost by global standards.³
Transfers are commonly used to support things like extended family living abroad, fund education, and invest in property, reinforcing deep financial ties between the two nations.

Pakistan: £2.18 billion received from the UK¹

Second only to India, Pakistan’s strong UK remittance corridor is largely fuelled by historic migration patterns. With competitive fees (2.90% for £148, 7.76% for £370 on average for many remittance providers), transfers are often directed toward household expenses, rural development, and education, making them essential for many communities.³

Nigeria: £2.04 billion received from the UK¹

Nigeria is one of the largest remittance recipients in Africa, and the international link between the UK and Nigeria is particularly active due to generational immigration. Remittances to Nigeria are often used for daily household expenses, supporting education, healthcare, and small business investments.

China: £918 million received from the UK¹

Due to stringent capital controls and tight anti-money laundering regulations, remittances to China are more complex than to other countries.
These regulations lead to the increased use of bank transfers, often limiting the use of mobile wallets or informal money transfer channels. This results in higher average fees of around 6.30% for £148 transfers across over 80 providers.³ This also often means slower processing times for many remittance transfer companies compared to links like India or Pakistan.

Kenya: £755 million received from the UK¹

Kenya’s remittance market is highly digitised, particularly through the recent emergence of fintech platforms, which allow recipients to receive funds directly into mobile wallets like M-Pesa.
This infrastructure has driven significant growth in the remittance climate, especially for rural populations with limited banking access.

The Philippines: £709 million received from the UK¹

The Philippines is one of the most remittance-dependent economies globally, with foreign transfers accounting for almost 9% of national GDP.² The average fee for many remittance providers for a £148 transfer is just 4.03%, among the lowest in the Asia-Pacific region.
Overseas Filipino Workers (OFWs) often send money home to help cover their family’s essentials like food, housing, healthcare, and education, as well as putting some aside for their own savings for the future. They also often purchase goods and make investments overseas.

Bangladesh: £605 million received from the UK¹

While the volume of transfers is lower than in other South Asian countries, fees remain relatively high for Bangladesh on average across various providers (5.62% for £148, 4.42% for £370).³ Remittances from the UK often supplement agricultural income or cover healthcare costs, particularly in rural districts where governmental financial support is limited.

Thailand: £287 million received from the UK¹

Remittances to Thailand are lower than in many other Asian countries, partly due to higher average fees for many remittance providers (6.61% for £148). Transfers are frequently tied to personal support for family members, property maintenance, or retirement plans, especially within regions popular among expatriates from the UK.
Arrow icon showing 9 in 10 remitters send money abroad to family

UK money transfer habits

1. 90% of UK-based remitters send money to support family and friends¹

According to The Migration Observatory’s analysis of The UK Household Longitudinal Study, nine in 10 of all remitters based in the UK send money to their loved ones. This demonstrates how remittances are primarily used to support those closest to them, over other responsibilities.
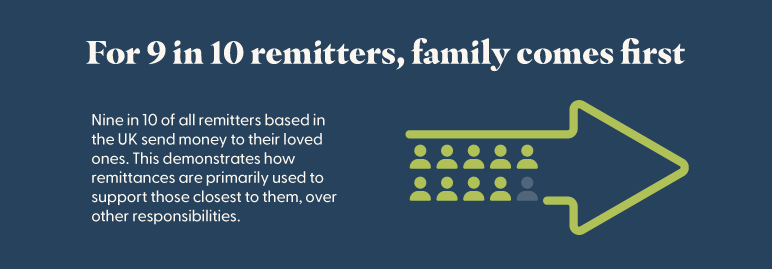
Many migrants view sending money abroad as a moral responsibility, often prioritising family needs over personal savings.

2. One in 10 sends remittances to support community initiatives abroad¹

Beyond direct family support, remittances are often used to strengthen local infrastructure through funding for schools and humanitarian projects. They often represent collective efforts from migrant communities to support areas of their home country, pooling resources for shared causes. Many also support community initiatives overseas as a form of investment or to aid development.

3. Only 3% are repaying loans or debts¹

Only three out of every 100 UK remittance senders use the money to repay loans or debts. This suggests that formal financial obligations, such as bank loans or structured repayment plans, play a minimal role in how funds are used.
Instead, support is often directed toward informal borrowing arrangements between family and friends.

4. Another 3% send money to invest in property, business, or education¹

Another 3% of remittances are sent to invest in property, business, or education. These transfers are less about immediate needs and more about building long-term stability and opportunity.
For some senders, this means purchasing land or a home to retire abroad. For others, it’s seed money for a small business or tuition fees to help relatives gain qualifications.

5. Around 27% of UK residents born overseas remitted money in 2021/22¹

More than a quarter of UK residents born abroad sent money overseas in 2021/22, showing the UK’s significant role in global remittance flows. For many migrants, these transfers are not one-off gestures but a consistent, long-term financial commitment woven into their monthly budgeting.
This regularity indicates many senders' dual responsibilities – maintaining their lives in the UK while providing crucial financial support to family or communities abroad.

6. Remittance likelihood varies by region of origin¹

Among UK residents born in Sub-Saharan Africa, 40% remit, which could indicate accessing financial projects abroad, investing, or international borrowing. Business owners also often pay international employees.
The figure is slightly lower for those from the Middle East, North Africa, and Central Asia, as 37% send money abroad. In contrast, only 8% of UK-born nationals remit money.

Why Remitly users send money abroad

1. Birthdays are the most common reason to send

According to a Remitly survey of 3,548 remittance senders across eight countries, more than half of remittance senders globally (53%) and in the UK (52%) sent money for birthdays. This consistency across markets shows how regular, yearly celebrations drive users to send money abroad.

2. Christmas is the leading seasonal occasion

Christmas drives 38% of global transfers linked to special events and 35% among UK senders. The festive occasion is one of the busiest times of year for international money flows, reflecting cultural traditions and higher family expenses.

3. Weddings drive more remittances from the UK

One in five UK senders (20%) said they send money for weddings, compared to just 16% globally. This suggests UK-based senders place slightly more importance on supporting these ceremonies abroad.

4. Some remittances are linked to religious festivals

Globally, 6% of senders reported transferring money for Ramadan and Eid, while in the UK this share was higher at 9%. Easter also plays a larger role in the UK (14%) than the global average (9%), demonstrating the impact of different cultural and religious calendars on remittance.

5. Other life events impact remittance sending

Outside of birthdays and major celebrations, senders also remit for new babies (11% UK and globally), Mother’s Day (15% UK and 16% global), and education milestones (8% UK and 9% global).This shows that remittances are often tied to family and events, not just emergencies or daily bills.

Remittance flows by GDP

1. High-GDP countries send more than they receive²

Larger economies like Germany (£17.51 billion sent) and France (£14.56 billion sent) were big remittance senders from 2020 to 2024.
In Germany, personal remittances account for just 0.5% of GDP, while this figure is 1.2% for France. This difference reflects a strong domestic economy and a large foreign-born population sending money abroad. These transfers include all money sent between resident and non-resident parties, as well as employee compensation.

2. Low to middle-income countries are highly remittance-dependent²

Countries like Nepal (33.1% of GDP in remittances), Guatemala (19.1% of GDP in remittances), and Nigeria (11.3% of GDP in remittances) show more reliance on personal remittances received between 2020 and 2024.
This level of dependence often coexists with migration due to economic hardship or instability. Remittances are often essential for needs like food, education, and healthcare.

3. South Asia leads in total volume and GDP share²

India tops the chart with £101.89 billion received from 2020 to 2024, though this is only 3.5% of its GDP. This shows that large economies can still rely heavily on international monetary flows without being dependent on them.
Pakistan (9.4% of GDP) and Bangladesh (6.0%) show higher proportional reliance. These remittances affect rural income, foreign exchange stability, and poverty alleviation.

4. Remittances are sometimes used as economic stabilisers²

In countries like Uzbekistan (14.4%), Egypt (4.9%), and Ukraine (6.3%), remittances served as buffers against domestic economic shocks, conflict, or currency devaluation over the last four years. These economies may see circumstantial spikes in remittance flows during crises.
This injection of foreign currency can help communities cover essential costs like food, rent, and medical care.

5. Remittance inflow does not always mean remittance dependency²

China received £23.25 billion in remittances between 2020 and 2024, making up only 0.2% of its GDP.
However, high remittance reception doesn’t necessarily mean high dependence. Unlike in many lower-income countries, where remittances are used to cover essentials like food or healthcare, funds sent to China could be directed toward long-term investments. This means they tend to function as a tool for upward wealth-building, rather than a basic safety net.

Remittance inflow statistics

1. Mexico received £50.06 billion in remittance inflows since 2020²

As the second-largest recipient globally after India, Mexico’s remittance volume reflects its strong migratory ties with the United States. Funds are used widely across rural regions, particularly in housing, food security, and family health costs. Our analysis of World Bank data showed how over £50 billion had flowed into the South American country since 2020.

2. The Philippines received £29.81 billion in the last four years²

With a strong overseas workforce in healthcare, maritime, and domestic services, the Philippines ranks in the global top five of personal remittances received. The Philippines, on the whole, received nearly 150 times more in remittances than it sent around the world between 2020 and 2024. One reason for this could be that remittances are a major contributor to household income, education, and property investment.

3. France and Germany receive billions despite being major senders²

Despite being two of the world’s largest remittance-sending nations, France and Germany also receive substantial amounts from abroad – £27.28 billion and £15.71 billion from 2020 to 2024.
These inflows reflect the reality that transnational financial ties are not one-way. In both countries, significant immigrant and expatriate populations maintain strong links to their homelands, while citizens living or working overseas often spend money abroad, invest overseas, and use international savings accounts.

4. Romania and Poland receive steady inflows²

People in countries like Germany, Italy, the UK, and France regularly spend abroad. Sometimes this is to support parents, spouses, and children, and other times it is for education expenses and in an attempt to grow money overseas. This can also include business owners with overseas employees.

5. The United Kingdom received £3.58 billion in remittances in the last four years²

While the UK is widely seen as a sender country, it still receives a notable amount. These remittances may come from British citizens living abroad, expatriates returning funds, or foreign pension and investment income.
Despite accounting for just 0.1% of GDP, the UK ranks among the top 40 remittance-receiving nations globally.
Graph showing money transfer trends by year and how remittances have changed

Money transfer trends by year: How have remittances changed?

1. UK remittances reached £9.08 billion in 2024²

This marks a record high for outward flows from the UK and is almost 87% more than the personal remittances received.
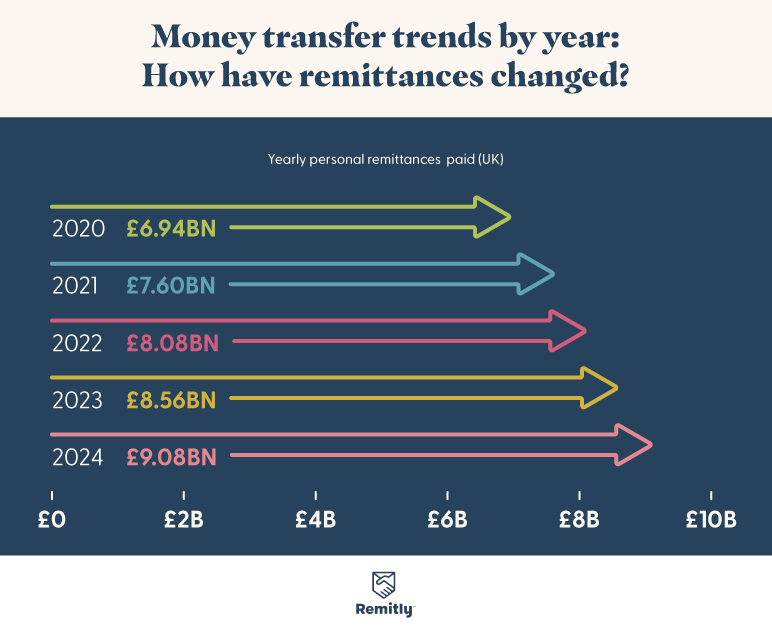
The increase reflects inflation-adjusted transfers and the growing number of migrants and dual-residency workers maintaining financial ties to their home countries. Net migration in 2024 was lower than in 2022 and 2023, at 431,000, according to The Migration Observatory.
Despite this, it was still much higher than migration during the 2010s, which sat at around 200,000 to 300,000. It also highlights the UK’s role as a key global remittance hub.

2. Remittances have increased by 30.79% since 2020²

In 2020, UK remittances totalled £6.94 billion. Since then, there has been a consistent increase due to factors such as post-COVID economic recovery, increased access to digital markets, and rising cost of living in many developing countries, leading to increased reliance on family support.
This surge has come alongside a boom in fintech and mobile remittance platforms, making it easier for senders to remit funds frequently and in smaller increments.

3. Between 2023 and 2024, remittances rose by 6.06%²

Remittances increased from £8.56 billion to £9.08 billion between 2023 and 2024, more than 6%.
This annual growth rate reflects sustained momentum in international transfers. It suggests that remittance behaviour is now an embedded financial habit for many UK residents, rather than a response to a short-term crisis.
As global migration continues to rise, this figure will likely trend upward in 2025 and future years.

FAQ on remittances

1. What is a remittance corridor?

A remittance corridor is a monetary flow between two countries. For example, the UK to India corridor is one of the largest involving the UK, with billions transferred each year. Migration patterns, transaction costs, and the availability of transfer services shape corridors.

2. What are remittance inflows and outflows?

Inflows are remittances received by a country, while outflows are money sent abroad. The UK is primarily an outflow country, with £9.08 billion sent in 2024, but it still receives £3.58 billion in inflows.

3. What are remittance fees?

Remittance fees are the costs charged by providers to send money internationally. They can include flat transfer fees, percentage-based charges, or currency exchange costs. Remittance fees can differ significantly by provider, so make sure to choose the platform carefully.

Methodology

Interested in the current remittance landscape, Remitly collected extensive data on personal remittances sent and received worldwide and year-on-year changes.
Total personal remittances received (as % of GDP & in USD), personal remittances paid for each country were sourced from the following World Bank sources: The same source was also used to source historical remittances paid from the UK (2020-2024).
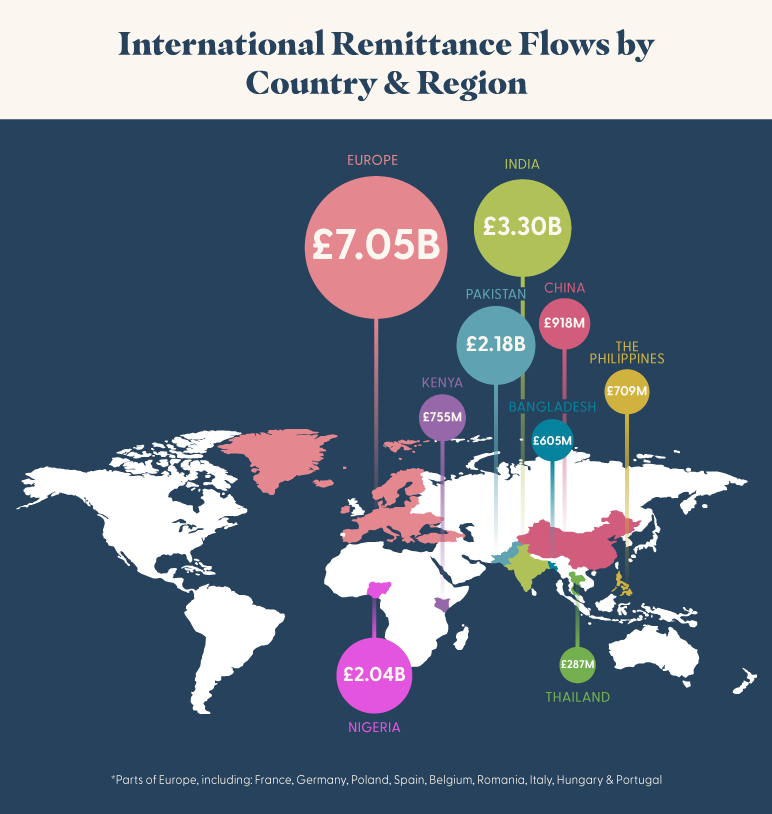
The largest destination countries for remittances sent from the UK were sourced from the World Bank bilateral remittance matrix, via the Migration Observatory.
The World Bank's Remittance Prices Worldwide was used to calculate:
  • Year-over-year average fees (2019–2024) for $200 and $500 transfers.
  • Average fees by destination country (2019–2024).
  • Average fees by payment method used to send remittances (Cash, Bank Transfer, Card).
Averages were calculated using the mean of all observations for each method or country and are unweighted.
Note that for payment methods, records containing multiple methods (e.g., “Cash, Debit card”) were split into separate groupings (e.g., “Cash” and “Card”) to avoid duplication.
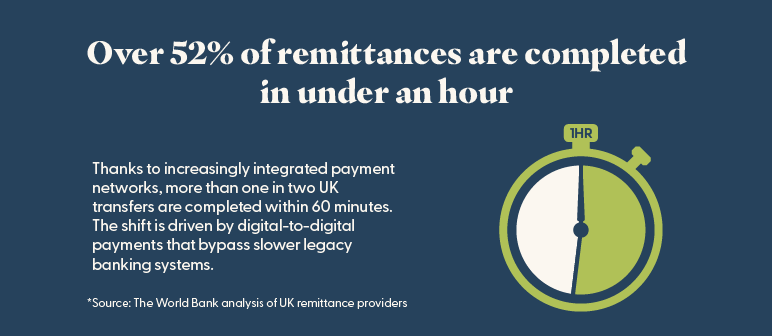
Average delivery speeds were also calculated using the above data. These categories (e.g., “Less than one hour” and “Next day”) were counted across all records (2019–2024). The percentage of total quotes was calculated for each speed category, and a weighted average delivery time was estimated by assigning approximate hours to each category.
The most common reasons for sending money abroad and the proportion of UK residents sending remittances were sourced from the Migration Observatory's analysis of UKHLS data.
All figures were converted from USD to GBP on August 14th, 2025, using Remitly’s currency converter. This currency conversion was done using Remitly’s new customer rate and does not include any fees that a service, like Remitly, may charge in a scenario like this when sending money abroad. Rates are subject to change and may be subject to sending limits.
Remitly data comes from a market research survey by Remitly of 3,548 remittance senders located in eight send countries (including Remitly customers as well as those who have used other money transfer providers) about the occasions they have sent for in the last 12 months; survey fielded September 19 to October 9, 2024.
UK data comes from the same market research survey by Remitly, speaking to 238 remittance senders located in the country.
ENDNOTES
¹ https://migrationobservatory.ox.ac.uk/resources/briefings/migrant-remittances-to-and-from-the-uk/
² https://data.worldbank.org/indicator/BM.TRF.PWKR.CD.DT?locations=GB
³ https://remittanceprices.worldbank.org/data-download
https://w3.unece.org/SDG/en/Indicator?id=126

More Insights on Money Transfers

Three red paper airplanes breaking through a barrier

Breaking Barriers: How to Overcome Common Money Transfer Challenges

Discover simple solutions to sending money internationally. Address hidden fees, safety, exchange rates, and delivery delays with confidence.
Learn How to Send Money Abroad
Grandmother and granddaughter sitting together smiling for a photograph

The Top 9 Reasons People Send Money Home

Sending money home is more than just a transaction—it’s a vital way to support loved ones and stay connected across borders.
Learn Why People Send Money Home